
I Re-Ran My Own RL Trading Paper 75 Times. The 55% Return Never Came Back.
So I started a reproducibility lab for trading AI and made our own paper its first report. Just now Our paper reported a deep reinforcement learning agent that earned 55.5% a year on 20 large-cap stoc...

So I started a reproducibility lab for trading AI and made our own paper its first report.
Just now
Our paper reported a deep reinforcement learning agent that earned 55.5% a year on 20 large-cap stocks. I re-ran it 75 times, five random seeds per agent, deciding at the close, filling at the next day’s open and paying a 0.1% fee per trade. The best run earned 46% a year. Holding the same 20 stocks in equal weight earned 29.7%.
This article was drafted with the help of an AI writing assistant. Every number in it comes from the public report and evidence files linked below.
What we claimed
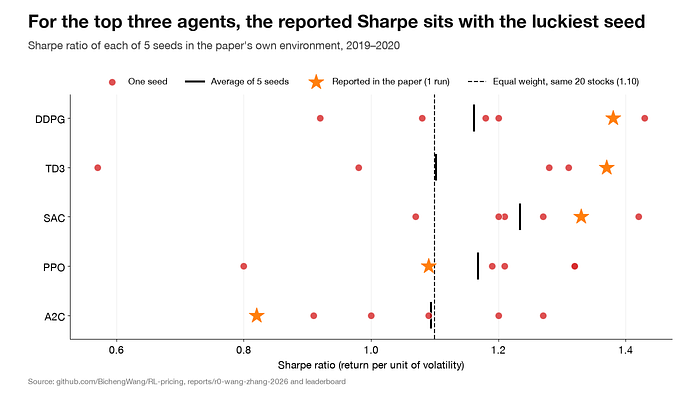
In June 2021 Xinyi Zhang and I wrote _Applying Deep Learning to Stock Trading: LSTM Forecasting and Deep Reinforcement Learning_. In September 2026 we posted it to arXiv as _Deep Reinforcement Learning for Equity Trading: Benchmarking Actor-Critic Methods with Forward Retraining_ (arXiv:2609.31870). It trained five agents (A2C, PPO, DDPG, TD3 and SAC) and an LSTM forecaster on 20 large US stocks and tested them on 2019–2020. DDPG led with a 55.51% annual return and a Sharpe ratio (return per unit of volatility) of 1.38; TD3 and SAC followed at 1.37 and 1.33.
Every one of those numbers came from a single run. The 20 stocks were the largest companies in 2021, so the universe was chosen with hindsight. The paper says both things in its limitations. Saying them is not the same as measuring what they cost.
How I re-ran it
Five seeds per agent, the same 20 stocks, the same window, and three setups:
- The paper’s own environment, run with `python main.py --mode train`, now deciding at the close and filling at the next open, with a 0.1% fee per trade.
- The same environment with one rule switched off (more on that rule below).
- A separate benchmark environment that trades portfolio weights instead of share counts and picks each checkpoint on 2017–2018 validation data.
That makes 25 runs per setup and 75 in all. The yardstick is the simplest portfolio there is: buy all 20 stocks in equal weight and hold them, called 1/N.
The 55% return did not come back
No run in any setup reached 55.5%. The best of all 75 was 46.0% (SAC, seed 0). The median of the 50 runs in the paper’s own environment was 26.1%, below the 29.7% that 1/N earned by doing nothing. Most of the headline came from the period and the stocks, not from the agent: 2019–2020 was a strong market, and these were the stocks that had already won.

The Sharpe ratios held up better, but only partly. The reported 1.33–1.38 are reached by the luckiest seeds, not by the typical one. The seed means are lower: DDPG 1.16, TD3 1.10, SAC 1.23, against 1.10 for 1/N. One lucky seed is enough to write a paper; five seeds show how much the result depends on the seed.
The crash rule was not learning
The paper’s environment has a default rule that sells everything when a market turbulence index crosses its 99th percentile. The 2021 manuscript does not mention it. With the rule on, all 25 runs moved to cash on the same five sessions of March 2020: the 17th, 20th, 23rd, 24th and 25th. The environment made that call for every agent.
Switching the rule off moves the measured market exposure (beta against 1/N) from 0.30–0.56 to 0.95–1.00. It also drops the seed-mean Sharpe of every agent except SAC below 1/N. Part of what looked like learned crash protection was a hard-coded exit.

SAC survives, but two years cannot prove it
One agent stays ahead without the rule. Averaging SAC’s five seeds day by day gives a Sharpe ratio of 1.32 against 1/N’s 1.10, with an alpha of 7.5% a year. The bootstrap p-value is 0.13, not significant.
Get Kenneth B.C. Wang’s stories in your inbox
Join StartsNest for free to get updates from this writer.
Remember me for faster sign in
That is not bad luck; the window cannot answer the question. Over these 505 trading days, the standard error of an annualised Sharpe ratio is about 0.69, so a one-sided 5% test needs an edge of about 1.13. The paper’s best claimed edge over 1/N was 0.28. Two years of daily data cannot confirm or reject an advantage that small.
It is not just our paper
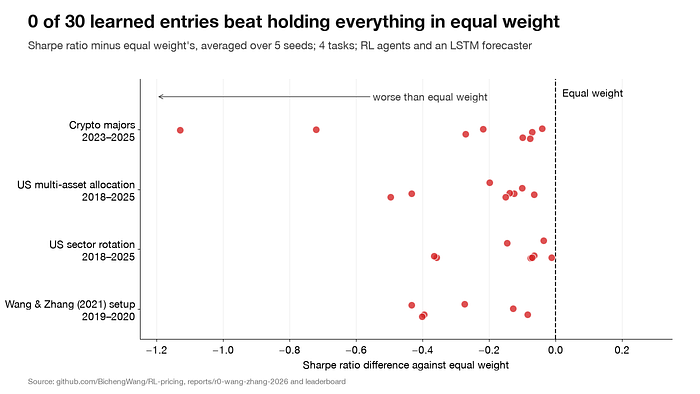
The same code runs a benchmark on four tasks: US sector ETFs and a US multi-asset mix (both tested on 2018–2025), the ten crypto pairs with the most Binance volume in Q2 2018 (2023–2025, delisted coins included), and the paper’s 20 stocks. Across them:
- None of the 30 RL and LSTM entries has a higher seed-averaged Sharpe ratio than 1/N. Only 5 of their 150 individual seeds do, so cherry-picking one would produce a publishable-looking result.
- SAC, TD3 and DDPG turn the portfolio over 46 to 326 times a year, and on the US tasks their alpha against 1/N is negative.
- A2C rediscovers 1/N. On the US sectors its five seeds land at a Sharpe ratio of 0.67 ± 0.01 against 1/N’s 0.68: the policy learns to stay near equal weights.
- The only statistically significant win over 1/N is not RL. Long-only minimum variance beats it in crypto by 0.86 of Sharpe (p < 0.001), mostly by holding the two least volatile coins, BTC and BNB.
A lab, not a takedown
The re-test became RL-pricing, a reproducibility lab for trading AI. Each report follows the same protocol:
- Pre-registered. The claims and the rule that decides each one are committed before anything runs. The commit time is the evidence that the plan came first. R0 is the exception, as the next section says.
- Three levels. L1 replicates with the authors’ code. L2 re-tests under one engine: next-open fills, fees, at least five seeds, universes chosen before the data starts. L3 tries new windows and, for anything that can run daily, live decisions.
- Fixed verdicts. Holds, partly holds, does not hold, or inconclusive, decided by thresholds written down in advance.
- Authors reply. The authors get the draft before publication, and their reply is printed next to the verdict, unedited.
- LLM agents only count live. A backtest of a language model can be contaminated by what the model saw in training. The ledger commits each decision to GitHub before the US market opens, and scoring checks the commit time against GitHub’s own run records.

Our own paper’s verdicts: the 55.5% return does not hold; the five Sharpe claims partly hold; the two LSTM claims are inconclusive, because the LSTM I could run is not the paper’s pipeline.
What this report did not do
R0 bends the lab’s own rules, and the report says so:
- The pre-registration was written after the runs, and it is labelled post hoc.
- There is no L1 run. The paper states neither fill timing nor fees, so whether its numbers reproduce under its own execution is untested.
- The baseline is 1/N, not the S&P 500.
- I used default hyperparameters. The paper describes its DDPG as tuned, so part of the DDPG gap may come from tuning rather than from execution.
- The co-author notice went out on 1 November, the same day as this article, not the seven days the protocol asks for. Xinyi’s reply, if she sends one, will be printed in full next to the verdicts.
Per-seed results, daily equity curves, input hashes and the commands that reproduce every number are in the report’s evidence folder.
What comes next
- R1, 1 December: the FinRL ensemble paper (Yang et al., ICAIF 2020), which reported a Sharpe ratio of 1.30 against the Dow’s 0.47 over 2016–2020.
- R2, 5 January: the TradingAgents backtest, Sharpe 5.6–8.2 on AAPL, GOOGL and AMZN in early 2024, with a check of whether the models remember that period.
- R3, February: TradingAgents running live on the same three stocks for three months. Its first decision was committed before the open on 29 October.
Try to beat 1/N
The benchmark is on PyPI:
pip install rl-pricing
rl-pricing bench tasks
A policy is one Python class that maps price history to portfolio weights, plus a JSON file that states how many configurations you tried. Merged submissions are frozen and scored each month on data that did not exist when they went public, so nobody can tune on the test set. To have a published claim tested, open an issue in the repository with the quote and a link to the code.
Which trading-AI result would you most like to see re-run?
_This article draws on the public RL-pricing repository: the R0 report, its evidence files and the benchmark leaderboard, as of 1 November 2026. It omits employer work and makes no investment recommendation._
Frequently Asked Questions
What is I Re-Ran My Own RL Trading Paper 75 Times. The 55% Return Never Came Back. about?
So I started a reproducibility lab for trading AI and made our own paper its first report. Just now Our paper reported a deep reinforcement learning agent that earned 55.5% a year on 20 large-cap stoc...
Which category does this article belong to?
This article is part of our Programming collection on StartsNest.
Is this content free to read?
Yes, all articles on StartsNest are free to read. No registration required.

Aisha Rahman
Aisha Rahman is a product researcher and consumer technology writer with 5 years of experience evaluating mobile devices, accessories, and digital services. She specializes in hands-on product comparisons, buying guides, and value analysis for budget-conscious consumers in emerging markets.
View all articles by Aisha Rahman →More to read
CleanMyMac Alternatives in 2026: What to Check Before You Pay
Just now _A practical checklist for choosing a Mac cleaner, plus a few options worth comparing._ Mac cleaners have earned a bad reputation. Subscriptions you forgot about, scare screens, and a “junk f...
Automated Line Surveillance & Margin Defense for iGaming Operators
Just now For sportsbooks and crypto-wagering platforms, sharp syndicates and opportunistic arbers rarely attack in massive, easily detected waves. Instead, they quietly exploit delayed data feeds and ...
CleanMyMac Alternatives in 2026: What to Check Before You Pay
Just now _A practical checklist for choosing a Mac cleaner, plus a few options worth comparing._ Mac cleaners have earned a bad reputation. Subscriptions you forgot about, scare screens, and a “junk f...
Comments (0)
No comments yet. Be the first to share your thoughts!